Database Optimization for High-Traffic Apps: Strategies That Scale
Database optimization for high-traffic applications is the difference between a product that holds up under real load and one that falls over during your best month. This post covers the query, schema, and infrastructure patterns that engineers actually use in production, including indexing strategies, caching layers, and how to spot the bottleneck before users report it.
The Database Bottleneck: Why Speed Fails Under Load
Most applications break at the database layer, not the application layer. The symptom is slow page loads and timeouts, but the cause is queries that were written during low-traffic conditions and never revisited. Vertical scaling buys time. It doesn't fix a design problem.
N+1 queries are a classic offender. Your ORM fires one query to fetch a list, then one more per record to resolve a relationship. At 10 users, that's invisible. At 10,000 concurrent users, that's a cascade of round trips that overwhelms your connection pool. The fix is a single join or a batch fetch, written once and never touched again if done correctly.
The cost difference between a well-optimized database and a neglected one isn't marginal. It's often 10x the infrastructure spend. Teams running under-optimized queries end up over-provisioning compute to compensate, which masks the real problem and inflates monthly cloud bills quietly for months before anyone looks at the query profiler.
Throwing more compute at a database design problem is like widening a road to fix traffic that's caused by a broken traffic light. The bottleneck doesn't move; the queue just gets longer somewhere else.
You can't horizontal-scale your way out of fundamentally broken query patterns either. Read replicas help distribute load, but if every replica is executing the same 800ms query, you've multiplied the problem, not solved it.
Why Database Performance Matters Now More Than Ever
High-traffic applications have no tolerance for latency. Users abandon after roughly 2 seconds of load time, and search engines factor page speed into rankings. Poor database performance punishes you twice: users leave and organic traffic drops.
Database costs scale non-linearly with poor optimization. Every wasted query is compute you're paying for, and cloud pricing means that inefficiency compounds. AWS Database Performance Optimization documentation shows that properly indexed queries can cut RDS costs by 40-60% compared to unindexed equivalents running against the same data set.
Legacy systems compound the problem. Queries written five years ago during a different traffic era often survive into production without a second look. Technical debt at the database layer is particularly dangerous because it's invisible until traffic exposes it. A join that ran in 12ms against 50,000 rows runs in 4 seconds against 5 million rows, and nobody rewrote it because it "worked."
Real-time features make this conversation unavoidable. Live dashboards, inventory sync, and push notifications require sub-100ms query response times consistently, not just at baseline load. If your architecture isn't built for that, real-time becomes a liability rather than a feature.

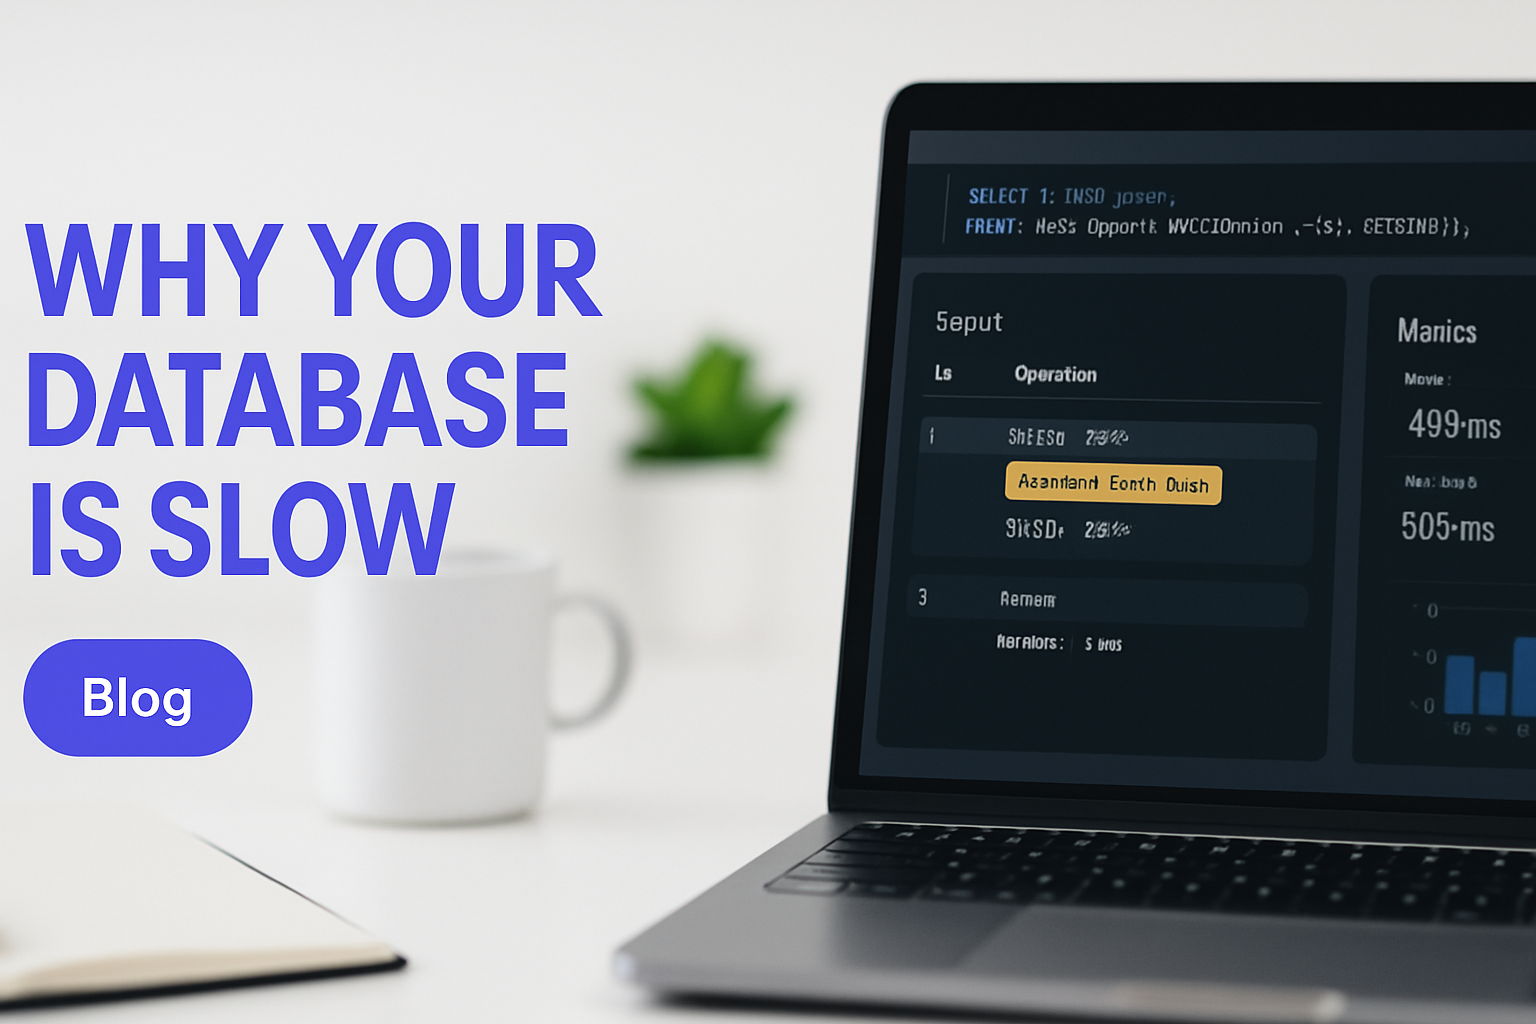
Engineer at workstation monitoring database performance metrics and query latency trends
The Core Framework: Three Layers of Database Optimization
Database optimization operates across three distinct layers, and skipping any one of them leaves performance on the table. The query layer, schema layer, and infrastructure layer each address a different class of problem, and the most effective optimizations usually touch all three.
Query-Level Optimization
Write queries that return only what you need. SELECT * is a convenience that costs you column reads, network transfer, and memory allocation you don't need. Use specific column names. Add LIMIT clauses where full result sets aren't required. Replace application-side loops with SQL window functions where your database engine can handle the aggregation in a single pass.
PostgreSQL Documentation covers EXPLAIN PLAN in depth for a reason: it's the single most valuable diagnostic tool available. Run EXPLAIN ANALYZE on any slow query before you touch anything else. The output shows you exactly where time is being spent, whether it's a sequential scan, a sort, or a hash join. Optimizing without reading it first is guessing.
Schema-Level Optimization
Add indexes on columns that appear in WHERE, JOIN, and ORDER BY clauses. Not every column. Only the ones that appear in those positions frequently in production queries. MySQL Performance Best Practices recommends measuring query frequency before indexing, because each index adds overhead to every write operation against that table.
Denormalization is a valid tool used selectively. If a join runs 50,000 times per day and the tables it joins update infrequently, storing the pre-joined result in a materialized view or a summary table is a legitimate trade: storage cost for query cost. It's not an architectural failure. It's a measured decision.
Infrastructure-Level Optimization
Connection pooling is non-negotiable at scale. Every raw database connection consumes memory and has a setup cost. A connection pool keeps a fixed set of connections open and hands them to application threads as needed. The latency reduction per query is typically 20-30%, and it prevents connection exhaustion under traffic spikes.
Read replicas separate your transactional traffic from your reporting and analytics traffic. Your dashboard queries hitting a replica means your write-heavy application tables stay uncontested. For truly high-volume systems, partitioning tables by time range or tenant ID reduces the scan surface area dramatically.
Implementation Patterns That Work in Production
Getting database optimization right in a live system requires a specific sequence. Skip the sequence and you spend time fixing the wrong things.
Start with observability. Enable slow-query logging at a 100ms threshold in your database. Postgres has log_min_duration_statement. MySQL has the slow query log. Without it, you're optimizing by intuition. With it, you have a ranked list of actual problems sorted by impact.
Index based on evidence. Pull your slow query log after a week of production traffic. Identify the top 10 queries by total execution time (frequency times duration). Run EXPLAIN PLAN on each. If you see full sequential scans on large tables, add indexes on the columns in the WHERE clause. Measure before and after using real query times, not estimated costs.
Cache at the application layer. Redis is the standard choice. Wrap your most expensive, most frequently called queries in a cache layer with an appropriate TTL. A product catalog that changes every 6 hours doesn't need a live database query on every page load. A user session needs fresher data. Match TTL to actual data freshness requirements, not to what's convenient.
Pool connections aggressively. If you're running a Node.js or Python application and opening database connections per request, you will hit connection limits under moderate load. PgBouncer for Postgres, or connection pooling built into your ORM, keeps the connection count predictable regardless of application concurrency.
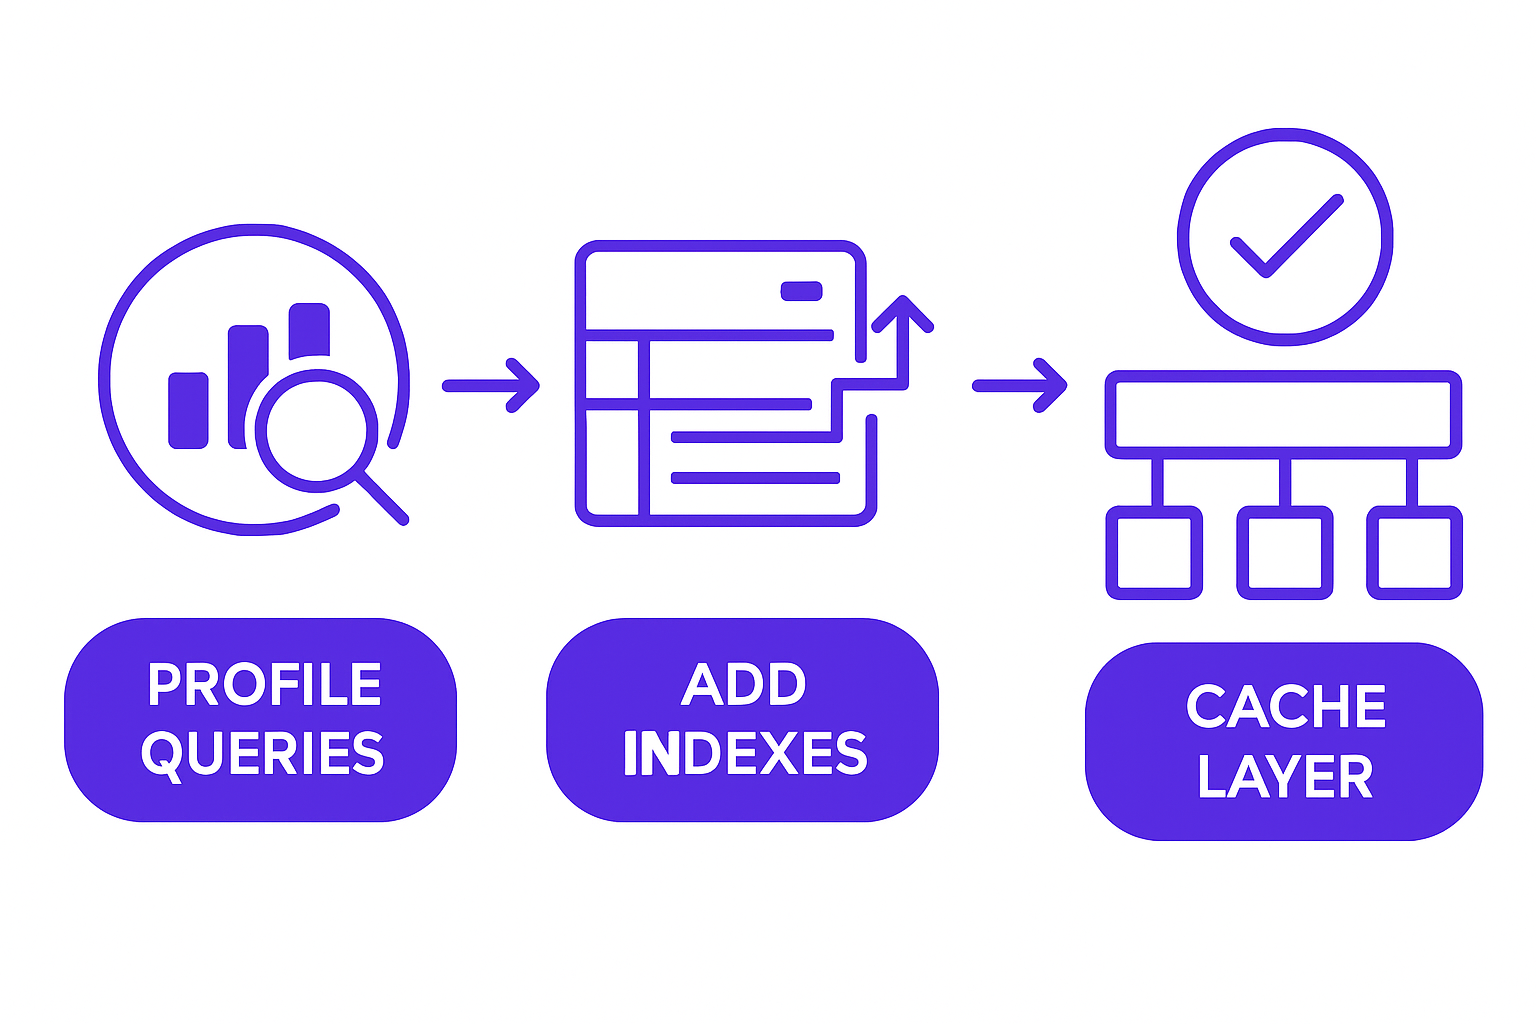
Database optimization workflow showing profile, index, cache, and monitor stages
Denormalize the expensive joins. Identify joins that execute at high frequency against tables that update infrequently. Create a dedicated summary table. Update it on a schedule or via a trigger. The query that previously joined four tables now reads a single row. This pattern is common in reporting layers and order history views where the underlying data rarely changes after creation.
Introduce replicas before you think you need them. The time to add a read replica is before traffic spikes, not during one. Routing all SELECT queries to a replica takes an afternoon to configure. Doing it at 2am during a traffic incident is not the right time to learn how replication lag works.
Building systems that scale requires database architecture, not just coding.
Common Pitfalls That Sink Database Performance
Knowing what works matters less if you don't know what breaks things quietly.
Over-indexing is common and damaging. Developers add an index for every query they write, and INSERT and UPDATE operations start slowing down because every write now has to update multiple index structures. The right index count on a heavily written table is usually two to four indexes, not twenty.
Optimizing without measurement wastes engineering time. Running EXPLAIN PLAN takes five minutes. Not running it means you might spend a day optimizing a query that runs twice per hour while the query running 10,000 times per hour goes untouched.
Locking issues are invisible until they cause visible freezes. A long-running transaction holds a row lock or a table lock. Other queries queue behind it. CPU stays low, the database isn't under memory pressure, but the application appears frozen. Check for long-running transactions and lock waits before assuming the problem is compute.
Stale cache data is a consistency trap. Setting a 24-hour TTL on data that changes every 30 minutes means users see outdated information. Always map cache TTLs to actual data update frequency. If you don't know how often the data changes, measure it before you cache it.
Ignoring connection limits causes queue buildup that looks like a performance problem but is actually a concurrency problem. If your database supports 200 connections and your application is attempting 1,000, the first 200 requests proceed normally and the rest wait. The fix is connection pooling, not more database instances.
How GroovyMark WebX Scales Databases That Matter
At GroovyMark WebX, database architecture is a day-one consideration, not something we revisit after launch when performance degrades under real traffic.
When you're building a custom platform, a client portal, or a real-time operations system, the access patterns are knowable before you write a line of application code. Our team instruments queries from the start, configures replication and caching patterns during the build phase, and load-tests before you go live. AWS Database Performance Optimization benchmarks confirm that systems designed with observability in place catch performance regressions orders of magnitude earlier than systems where monitoring is added post-launch.
Our ERP & Legacy System Integration practice addresses a specific problem: organizations running legacy systems with years of unreviewed query patterns, outdated indexes, and no caching layer. We profile the existing database, identify the high-impact queries, modernize the access layer, and bring the whole system up to a standard that handles production traffic rather than just surviving it.
For platforms with high read concurrency, our team implements read replicas, connection pooling, and intelligent caching as part of the original architecture. If you're running a Real-Time Operations & IoT Dashboard where device data feeds live displays at high frequency, the read layer needs to be designed for that volume before the first device connects, not after the first timeout.
You can see how teams scaled their systems across sectors in our portfolio. And if you want to let's talk about your architecture, the conversation starts with your current query profile, not a sales deck.
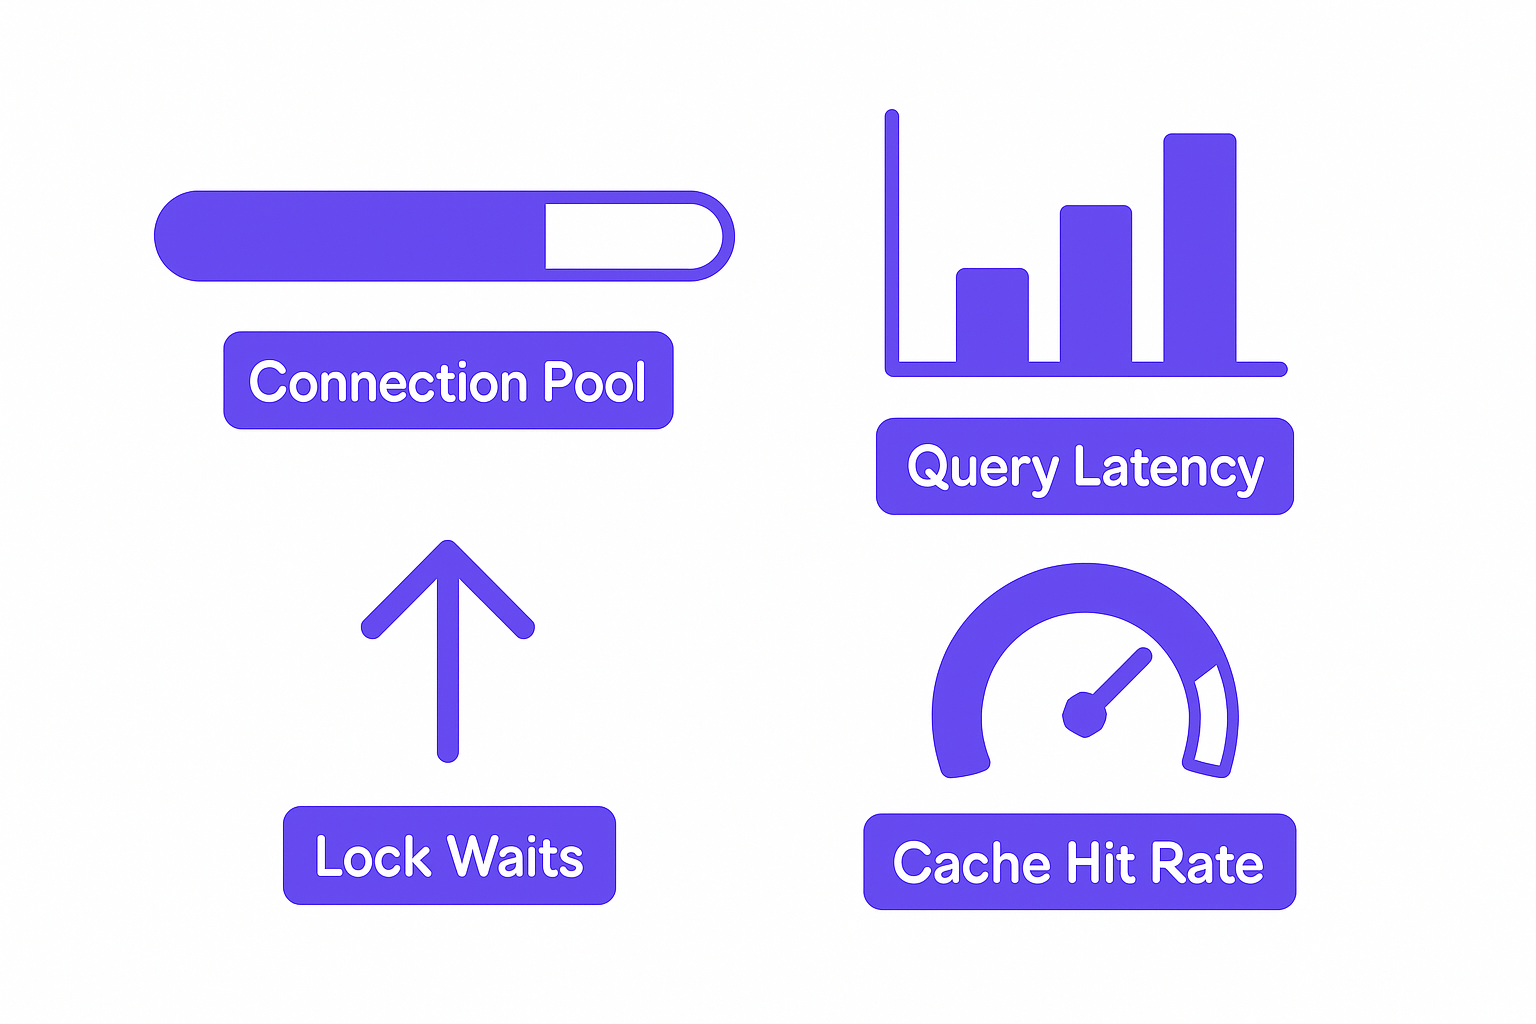
Real-time database monitoring dashboard with connection pool, query latency, and lock metrics
Every team eventually faces the conversation about database performance. The ones who have it during design spend far less than the ones who have it after a traffic spike has already cost them revenue and reputation. GroovyMark WebX has sat in both rooms, and the difference in outcomes is measurable.
If your current system is approaching its limits or you're building something that needs to handle real load from day one, let's talk about your architecture. The right decisions now are significantly cheaper than emergency optimization later.
Ready to architect a database that won't fail your growth?
Frequently asked questions
How do I know if my database is the bottleneck?
Enable slow-query logging at 100ms threshold and review your application logs for database wait time. If queries are taking longer than 50ms on average, your database is likely the limiting factor. GroovyMark WebX instruments all custom platforms with real-time database monitoring so you see performance degradation before users do.
Should I add indexes to every column used in WHERE clauses?
No. Indexes speed up reads but slow down writes. Index only columns that are queried frequently (at least 10+ times per hour in production). Use EXPLAIN PLAN to measure the actual impact before and after adding an index. Our team uses data-driven indexing strategies to avoid the index bloat that kills write performance.
What's the difference between caching and denormalization?
Caching stores query results temporarily (seconds to hours); denormalization stores redundant data permanently in the schema to avoid expensive joins. Caching is faster to implement but risks stale data. Denormalization requires more maintenance but guarantees freshness. The right choice depends on your data freshness requirements and update frequency.
When should I move to database sharding?
Sharding introduces complexity; avoid it until a single optimized database can't meet your load. That typically happens at 10k+ queries per second or when data size exceeds your storage/memory limits. Before sharding, try read replicas, better indexing, and caching. GroovyMark WebX helps teams design systems that scale without sharding whenever possible, and architects sharding correctly when it's necessary.
How do I load-test my database before production?
Use tools like Apache JMeter, wrk, or k6 to simulate production traffic against a staging database with production-scale data. Run tests for 30+ minutes to expose connection pooling and lock contention issues that appear only under sustained load. Always test peak traffic (2-3x average), not average load. Our team includes load testing in all platform builds to catch scaling issues before launch.