Database Performance Tuning for High-Volume B2B Applications
Database performance tuning is what separates a B2B platform that scales from one that collapses under its own weight. This post walks through the real causes of database slowdowns, a concrete diagnosis framework, and the tuning patterns that consistently cut response times for high-transaction systems, without a rewrite.
When Database Performance Becomes a Revenue Problem
Slow database performance stops being a technical inconvenience and becomes a revenue problem the moment customers notice. When response times climb from 200ms to 3 seconds, users drop off, sales stall, and your support queue fills with complaints your monitoring tools can't explain.
Your platform handled 100 concurrent users without a hitch. Then it hit 500, and everything changed. Reporting dashboards that refreshed in seconds now time out at 6pm when half your client base is online simultaneously. Your team has slowed feature delivery because every new addition seems to drag the whole system down further.
The worst part is the guesswork. You've added more hardware. You've bumped up your instance size. The numbers improved slightly, then crept back up. That pattern is the clearest possible signal that you're treating symptoms, not the underlying cause. Hardware doesn't fix query logic, and it doesn't fix schema design.
Why Database Performance Degrades Under Load
Database performance degrades under load for a small number of specific, fixable reasons. Missing indexes, bad query patterns, wrong isolation levels, and connection pool exhaustion account for the vast majority of production slowdowns in B2B applications.
The most common culprit is missing indexes on frequently-queried columns. Every full table scan consumes CPU and holds locks that block other transactions. But indexing is only half the story.
N+1 query patterns are probably responsible for more slow applications than any other single issue. Your ORM fires one query to fetch a list, then fires a separate query for each item in that list to pull related data. What should be one round trip becomes hundreds. At 500 concurrent users, that's catastrophic.
Unoptimized JOIN logic compounds the problem. Joining two tables with millions of rows on unindexed columns forces a sequential scan across both. The database has to read everything before it can return anything.
Then there's connection pool exhaustion. Long-running queries hold database connections. When your pool of 50 connections is fully occupied by slow queries, every new request queues. That queue manifests as the "random slowness" your users report but your monitoring tools struggle to attribute.
Transaction isolation levels are frequently misconfigured. Running SERIALIZABLE on high-concurrency tables locks row reads against concurrent writes. READ COMMITTED is sufficient for most B2B workloads and carries a fraction of the overhead. The PostgreSQL Documentation covers the trade-offs in detail, and the guidance is consistent: match your isolation level to your actual consistency requirements, not to a worst-case assumption.

Database engineer reviewing performance logs and query analysis on multiple monitors
A Diagnosis Framework for Database Bottlenecks
Before tuning anything, you need to know exactly where time is going. The diagnosis phase is non-negotiable, and it follows a logical sequence from the loudest signal to the quietest.
Start with the Slow Query Log
Enable logging for any query above 100ms. In PostgreSQL, set log_min_duration_statement = 100. In MySQL, set long_query_time = 0.1. Most database bottlenecks hide in the slowest 1% of queries, and those queries are usually running far more often than you'd expect.
Once you have a week of slow query data, group by query signature (not literal parameters). The top five query signatures by cumulative time are your starting point.
Run EXPLAIN PLAN on Every Slow Query
EXPLAIN ANALYZE in PostgreSQL and EXPLAIN FORMAT=JSON in MySQL tell you exactly what the query planner decided to do. You're looking for two things: sequential scans on large tables where an index should exist, and join node costs that suggest the planner is doing far more work than necessary.
A query returning 100 rows should not be passing 50 million intermediate rows through a join. If it is, you're either missing an index or your statistics are stale.
Key diagnostic signal: The difference between an index scan and a sequential scan on a million-row table is often 100x in query time.
EXPLAIN PLANwill tell you which one your database is actually using.
Check Connection Pool Metrics
Track active, idle, and waiting connections in real time. Spikes in "waiting" connections mean your pool is saturated. That's not necessarily a database problem, it may mean you need PgBouncer or ProxySQL sitting in front of your database before you touch a single index. The MySQL Performance Blog has documented connection pool saturation patterns extensively, and the recommendation is consistent: pool at the middleware layer, not just at the application layer.
Measure Lock Contention and Memory Allocation
InnoDB and PostgreSQL both expose lock wait times through system views. High lock wait times point to either schema design issues or isolation level mismatches. Check whether your buffer pool (InnoDB) or shared_buffers (PostgreSQL) is sized to hold your working data set in memory. An undersized buffer pool causes disk I/O on queries that should be served from RAM entirely.
Concrete Tuning Patterns That Scale
Once you have a diagnosis, the fixes follow a clear hierarchy. Start with indexing and query rewrites before touching architecture.
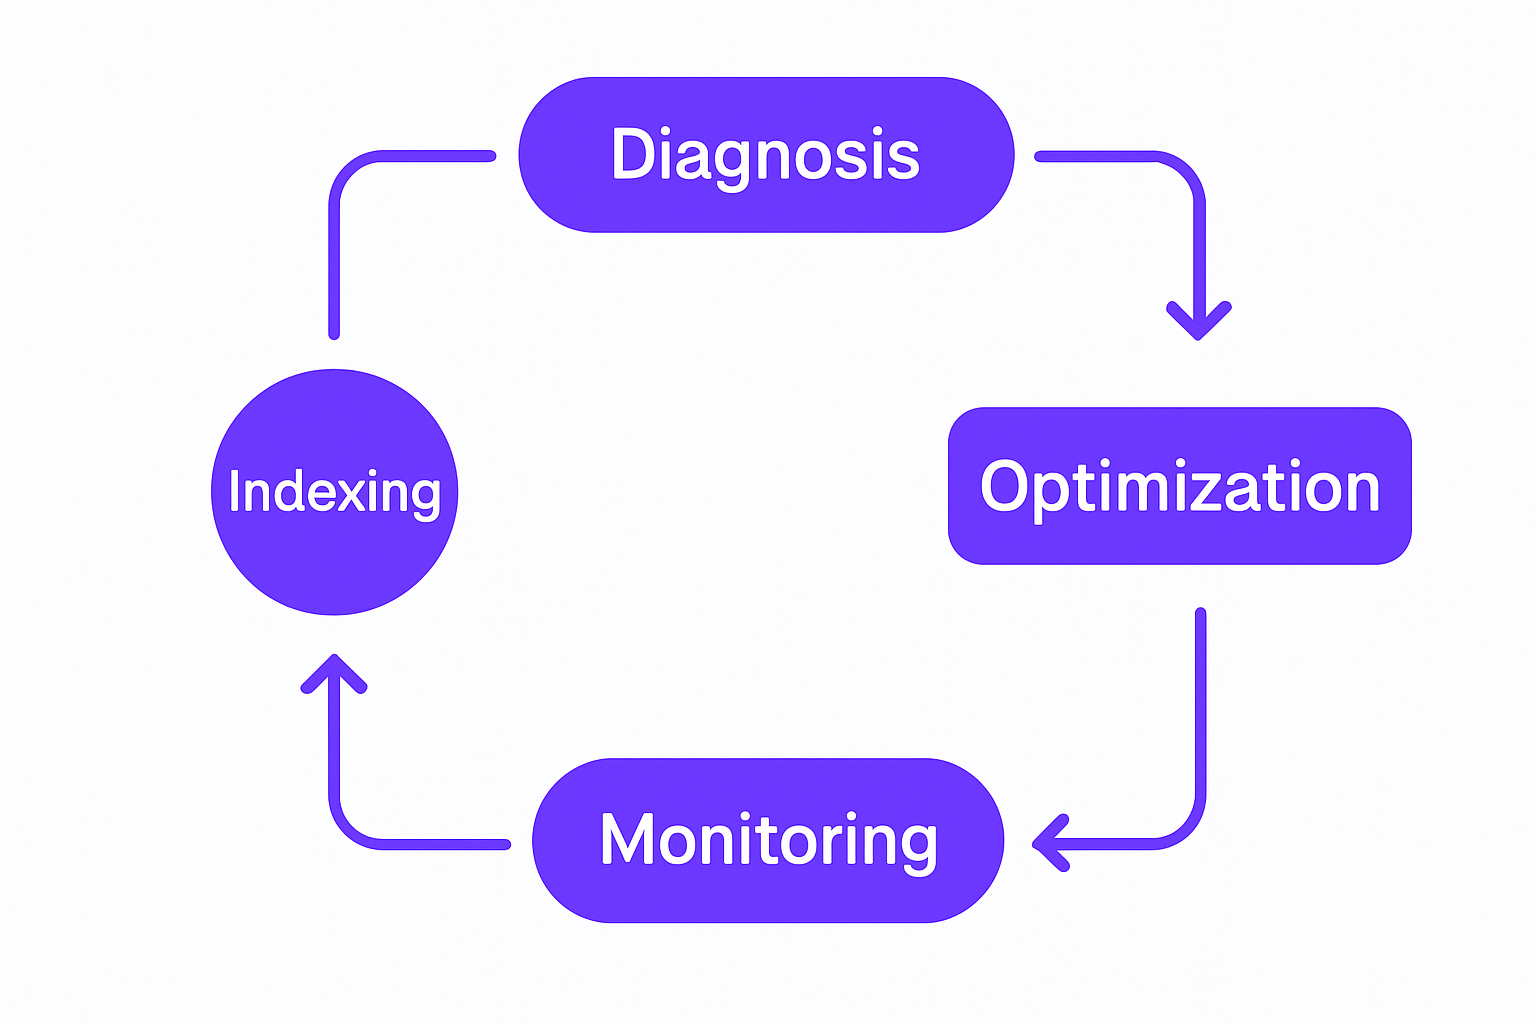
Database performance tuning workflow from diagnosis through monitoring
Strategic Indexing
Index columns used in WHERE, JOIN, and ORDER BY clauses. For multi-column lookups, composite indexes outperform individual column indexes because the planner can satisfy multiple predicates with a single scan.
That said, don't index everything. Each index adds overhead to every INSERT, UPDATE, and DELETE. Write-heavy tables with poorly considered indexes become slower with each additional index you add. Only index queries you've proven are slow.
Query Rewrites and Denormalization
Replace N+1 patterns with JOIN or subquery alternatives. Use window functions (ROW_NUMBER(), SUM() OVER, LAG()) for running totals and ranked results instead of cursor loops or application-side aggregation.
For reporting-heavy workloads, keep computed summaries in a separate table updated by a scheduled batch job or database trigger. Daily totals, monthly aggregates, account-level counts, these should never be calculated on-query against tens of millions of raw transaction records.
Connection Pooling and Write Batching
PgBouncer for PostgreSQL and ProxySQL for MySQL allow thousands of application connections to multiplex through a much smaller set of real database connections. This alone can eliminate queueing delays for applications that open a new connection per request.
On the write side, batching 100 to 1000 inserts into a single multi-row INSERT statement is an order of magnitude faster than a loop with individual inserts. The database commits once, flushes the log once, and updates indexes once. The throughput difference is significant.
Partitioning and Cold Data Archiving
Once tables cross tens of millions of rows, horizontal partitioning by date range or account ID becomes worthwhile. Queries scan fewer blocks, indexes fit in memory, and vacuum/analyze operations run faster.
Archive cold records. Move transactions older than 18 months to archive tables. The active table shrinks, queries speed up, and index maintenance becomes manageable again.
Need Help Diagnosing Your Database Bottleneck?
Common Mistakes That Sabotage Performance Gains
The diagnosis and tuning work can be undone quickly by a handful of well-intentioned but counterproductive habits.
Indexing without measuring is the most common. Adding indexes across the board "just in case" slows writes, wastes memory, and confuses the query planner. Only index what your slow query log has proven is causing problems.
Treating the database as a cache is another. If your application fetches the same record twice within a single request, the problem isn't the database, it's the application layer. Use Redis or memcached to hold frequently-read data that doesn't change between requests. This is particularly relevant for B2B platforms with heavy dashboard use, where the same config or account data is read on every page load.
Stale statistics cause query planners to make bad decisions. PostgreSQL's AUTOVACUUM runs ANALYZE automatically, but it can fall behind on tables with heavy write volume. Schedule manual ANALYZE runs on your largest tables during maintenance windows.
Migrations without a plan are a genuine production risk. Adding an index to a 500-million-row table locks writes for hours on older database versions. Tools like pt-online-schema-change and gh-ost handle this gracefully, but they require expertise to configure and monitor correctly. Database SRE Best Practices documents these patterns thoroughly and the consensus is clear: never run a large DDL change without a rollback plan and a write-lock impact assessment.
Finally, assuming your ORM is generating good SQL. It often isn't. Profile the actual queries hitting your database using the slow query log or a query monitoring tool like pgBadger or Percona's PMM. What the ORM looks like in code and what it generates in SQL can be very different things.
When to Rebuild vs. Tune: How GroovyMark WebX Helps
Most B2B platforms hitting performance walls don't need a database rewrite. They need a structured audit and targeted refactoring applied to the right five to ten queries.
At GroovyMark WebX, we've tuned databases for B2B operations platforms, order management systems, and ERP integration and legacy system integration builds operating under sustained high load. The approach is the same every time: profile the real production workload, identify the actual bottlenecks, and ship fixes that produce measurable improvements in response times your customers can feel.
Our ERP integration and legacy system integration work often includes a full database layer review. When you're connecting legacy systems to modern platforms, the data layer is where performance problems compound fastest. We address those proactively as part of the integration design, not as an afterthought.
In 80% of cases, a systematic diagnosis followed by targeted indexing and query optimization resolves the problem entirely. In the remaining 20%, we architect caching layers, read replicas, or schema changes as needed. All of that happens with zero downtime against live production systems.
The cost of a two-to-three-week senior engineering audit is a fraction of the cost of a platform rewrite that doesn't actually fix the root cause. Teams that work with GroovyMark WebX get a prioritized fix list with expected impact estimates before we write a single line of optimization code.
If workflow automation is generating high write volume into your database, those patterns get reviewed as part of the same engagement. A fast automation pipeline feeding into a slow database doesn't help anyone.
You can see how we've approached similar problems in our case studies.
Contact GroovyMark WebX to start with a performance audit. We'll profile your queries, show you exactly where time is going, and give you a concrete fix list ranked by impact.

Database optimization team workspace with performance dashboards and infrastructure planning materials
Poor database performance is a solvable engineering problem, not a hardware budget problem. A clear diagnosis, targeted indexing, and disciplined query rewrites will outperform a vertical scaling strategy every time. GroovyMark WebX has done this work across dozens of production B2B platforms, and the fastest path forward always starts with measuring before changing anything.
Ready to Optimize Your B2B Platform's Performance?
Frequently asked questions
How do I know if my database performance problem is actually a database problem?
Enable slow query logging at your database threshold (100-200ms) and review what's actually running. Use EXPLAIN PLAN to see if queries are using indexes. If 90% of your latency is database queries and the rest is network, the problem is the database. GroovyMark WebX runs this diagnostic in the first week of any engagement—we give you clarity before recommending fixes.
What's the fastest way to improve database performance without a rewrite?
Strategic indexing on frequently-queried columns, rewriting N+1 query patterns into single JOINs, and batching writes. Most teams see 2–10x speed improvement from query optimization alone. The second lever is connection pooling and caching. Rewrites are rarely necessary.
Can I tune my database while it's running and serving customers?
Yes, mostly. Adding indexes is online in PostgreSQL 11+ and MySQL 8.0+. Removing indexes is instant. Query rewrites require application deployment but no downtime. Partition migrations and schema changes need careful planning—background DDL tools exist (pt-online-schema-change, gh-ost) but require expertise. GroovyMark WebX has done dozens of zero-downtime optimizations on production B2B platforms. We'll assess your schema and build a migration plan that doesn't block traffic.
How much faster should I expect after tuning?
Depends on the bottleneck. A missing index on a frequently-joined column can improve query time by 100x. Fixing N+1 patterns often cuts response times in half. Connection pooling removes queueing delays entirely. The metric that matters is wall-clock latency your customers see—not just database time. GroovyMark WebX measures success by measurable improvement in API response times, dashboard load times, and report generation speed.
Should I use read replicas or caching instead of tuning the database?
All three work together, not instead of each other. Tune the database first—fix the actual bottleneck. Then add read replicas for heavy reporting workloads and application-layer caching for frequently-accessed data. If you add replicas and caching before tuning, you're just scaling bad queries across more machines. GroovyMark WebX recommends starting with an audit, then building the right architecture—reach out to discuss your specific situation.