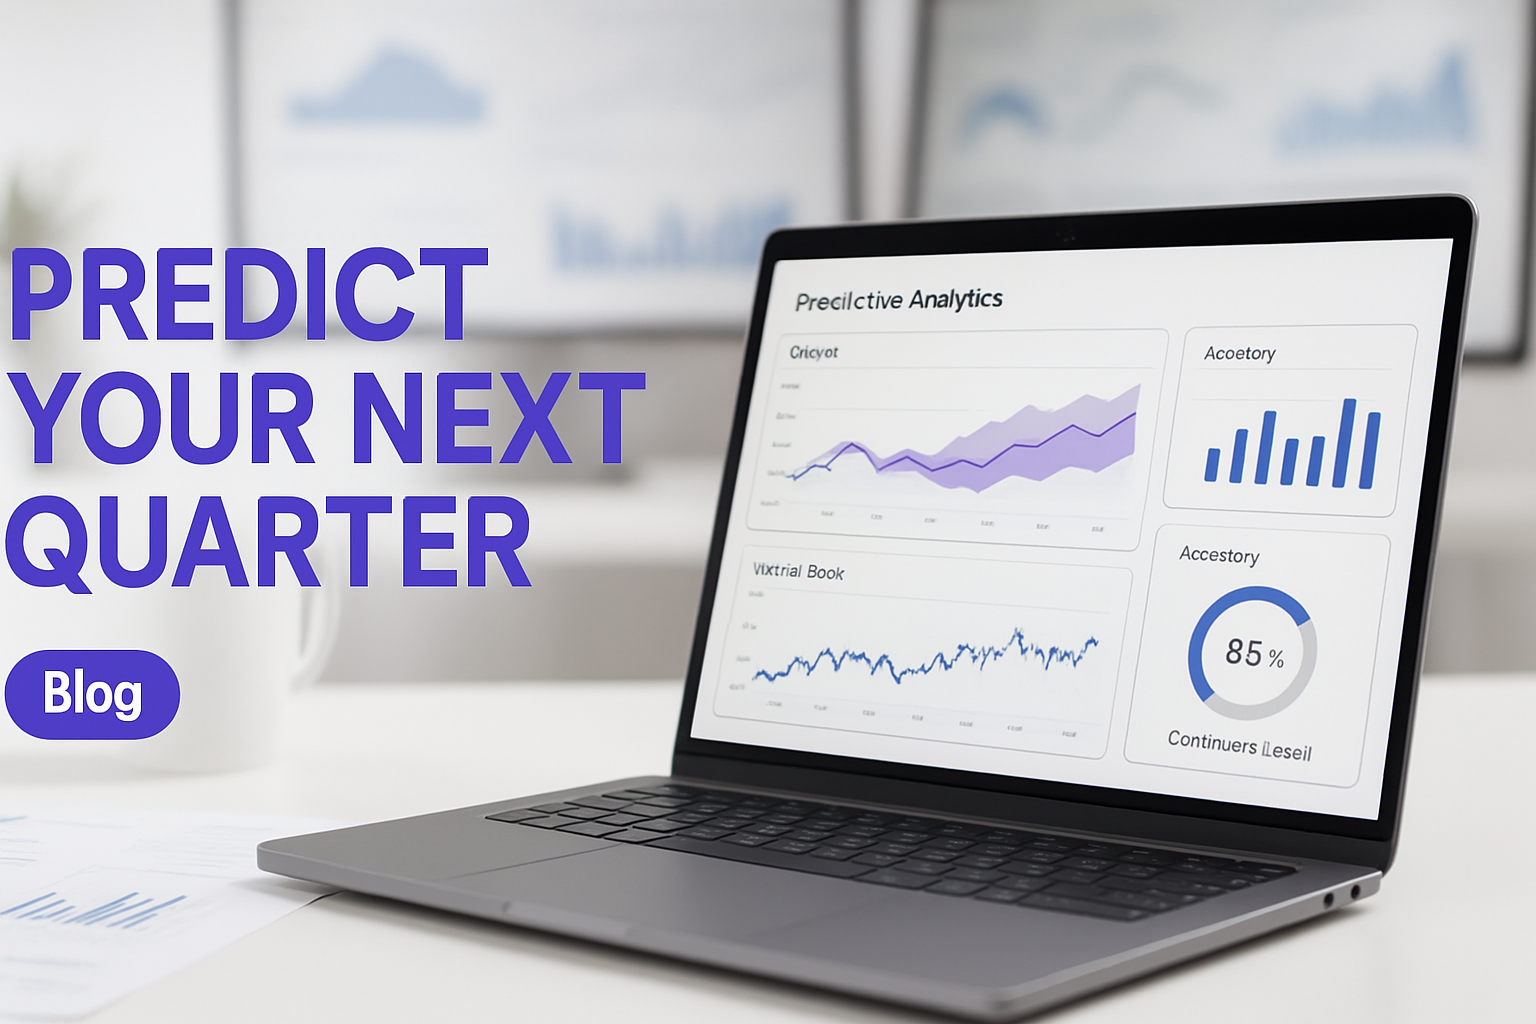
AI-Powered Predictive Analytics for Enterprise Software: Beyond Dashboards
Predictive analytics for enterprise teams isn't a reporting upgrade. It's a competitive position. Historical BI tells you what already happened. AI-driven forecasting tells you what's coming in the next quarter, with the explanations your leadership team needs to act before the opportunity closes or the problem compounds.
The Dashboard Trap: Why Historical Data Won't Save You
Most enterprise teams are flying with a rearview mirror. Dashboards answer yesterday's questions with yesterday's data, and by the time that data surfaces in your BI tool, the window to act has already closed.
Think about how a typical week runs at a 50-person B2B company. Someone's pulling reports Monday morning, building slides by Wednesday, and presenting findings on Friday. That cycle takes 40 or more hours of analyst time, and the output is a picture of what happened three weeks ago. It feels like control. It isn't.
Revenue leakage doesn't announce itself. Inventory surprises don't file a ticket. Churn spikes are already baked into the pipeline before your alert fires. Real-time dashboards create the illusion of oversight because the numbers update, but they still only describe the past. They don't tell you that your SMB segment is quietly eroding, that a logistics bottleneck will peak in six weeks, or that three of your best accounts are showing early signs of disengagement.
That's the trap. And the longer your team operates inside it, the further behind you fall on decisions that compound over time.
Why Predictive Analytics for Enterprise Matter Now: Market Forces Demanding Foresight
Predictive analytics for enterprise has moved from a "nice-to-have" to a business continuity issue. Supply chains, customer behavior, and demand patterns now shift faster than quarterly planning cycles can absorb, and founders and CFOs are increasingly held to forecast accuracy as a core operational metric, not just execution.
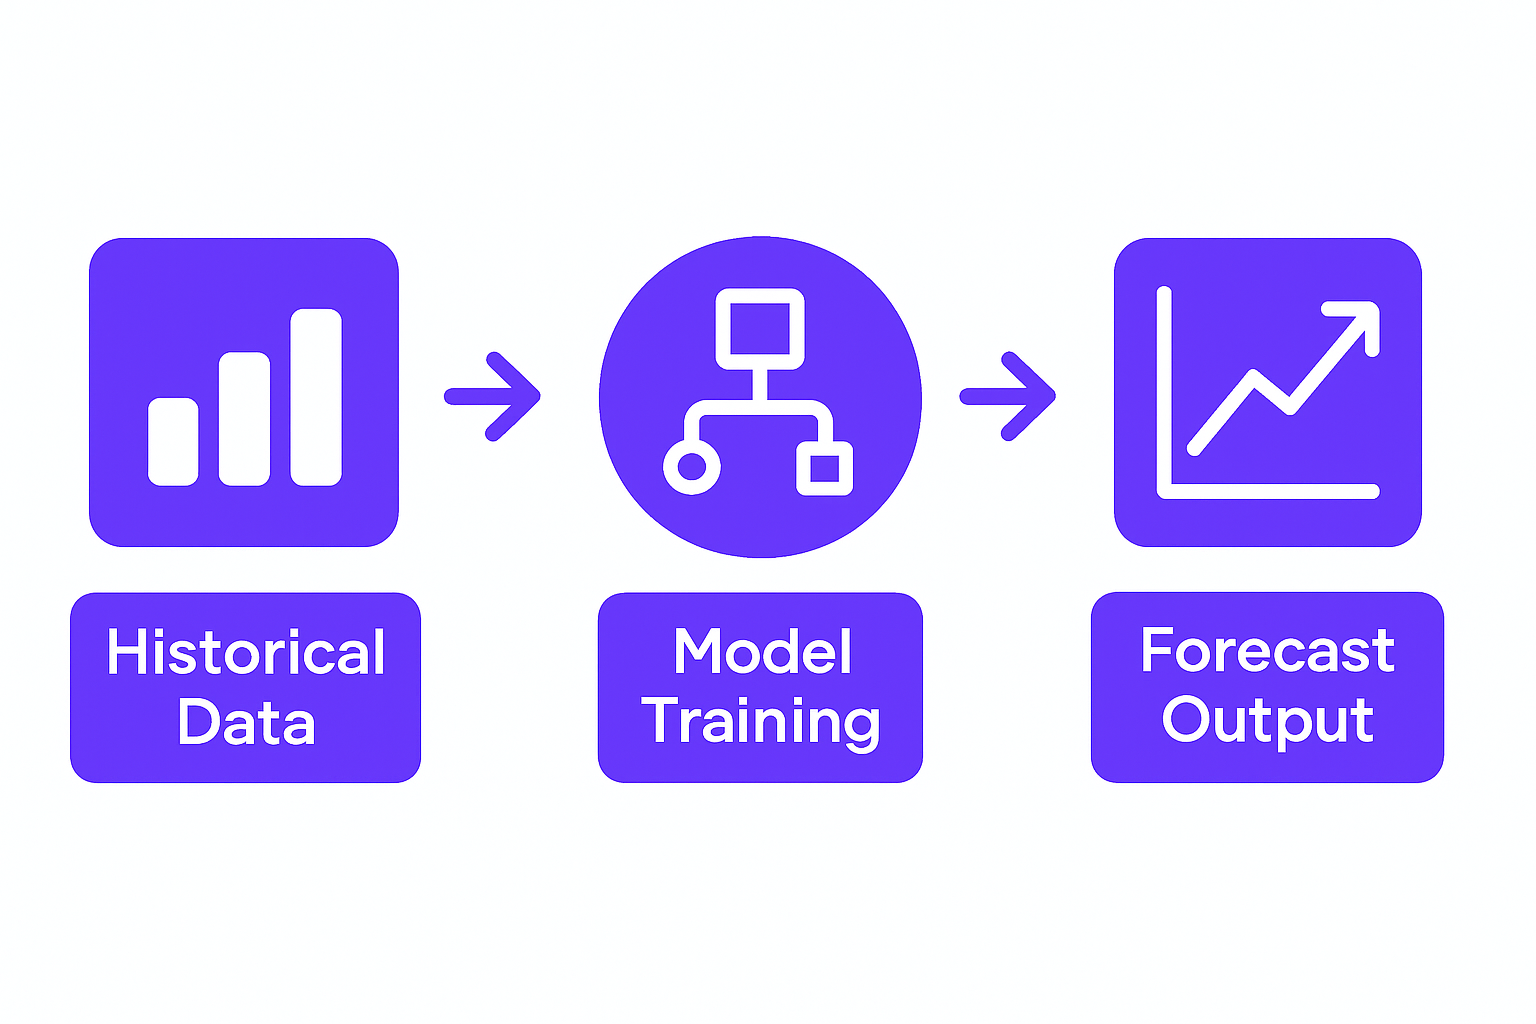
Three-stage workflow diagram: historical data feeds into model training, which outputs forecast predictions
McKinsey & Company research shows that enterprise adoption of AI forecasting has increased 340% in the past 24 months, with companies reporting 20 to 30% improvement in forecast accuracy after deploying predictive models. That's not marginal. That's the difference between a board conversation about confidence and one about surprises.
The practical advantage is lead time. AI models trained on historical behavioral and operational data can now predict 3 to 12 month outcomes at 85% or better accuracy across revenue, churn, and inventory. When your team has that signal 60 to 90 days earlier than your competitors, you can course-correct, reallocate resources, or capitalize on a shift before the market prices it in. That 2 to 4 quarter lead time changes what's possible.
Gartner analysis confirms that organizations deploying explainable AI models see 25% faster decision-making and 35% higher stakeholder trust compared to black-box models. The implication is clear: accuracy alone isn't enough. The prediction needs to come with reasoning that a CFO or COO can stake a decision on.
The Anatomy of Predictive Analytics: From Raw Data to Actionable Forecasts
A working predictive analytics system has five distinct layers, and each one matters. Miss one, and the forecast either doesn't arrive or arrives in a form no one trusts.
Data Ingestion
You connect your ERP, CRM, financial systems, and operational logs into a unified layer. Not a data warehouse you'll clean up "eventually," but a live, structured pipeline that updates on a schedule your business actually runs on.
Feature Engineering
This is where most projects lose momentum. Raw data doesn't teach a model anything useful. You have to extract signals: customer lifetime value trajectories, seasonal demand curves, cohort drift, payment cycle irregularities, product adoption rates. Feature engineering is skilled craft work, not automation.
Model Training
The AI learns the patterns inside your historical data and identifies the variables that drive your outcomes. Revenue, churn, demand, conversion probability. This is where the model earns its value or doesn't.
Prediction with Explainability
A number in a cell isn't a forecast. "Revenue drops 15% in Q3 due to a 40% increase in churn from your SMB segment" is a forecast. The distinction is explainability, and it's what separates a model your leadership team trusts from one they ignore. Harvard Business Review notes that leading enterprises now allocate 15 to 20% of their data budgets to predictive rather than historical reporting precisely because explainability has closed the gap between data science and executive action.
The Action Layer
Predictions that sit in a dashboard are still just dashboards. The real value comes when forecasts trigger something: an inventory reorder, a sales outreach sequence, a pricing adjustment, a support escalation. The action layer routes predictions to the workflows where decisions happen.
How Enterprise Teams Are Using Predictive Analytics: Patterns That Work
The use cases that deliver the most consistent ROI cluster around five operational domains. They're not theoretical. They're running in production at companies that decided to stop describing the past.

Engineer at dual monitors reviewing predictive analytics accuracy metrics and validation results
Revenue Forecasting
Replace static pipeline reviews with AI-generated forecasts updated weekly, with confidence bands and driver analysis. Your sales leadership stops arguing about which deals will close and starts working the accounts the model flags as high-probability.
Churn Prediction
Identify high-risk customers before they leave. Trigger retention campaigns or executive outreach based on individual risk scores, not gut feel or quarterly reviews that arrive two months late. The AI Lead Qualification & CRM Automation layer can work in parallel here to keep the response loop tight.
Inventory Optimization
Forecast demand by product, location, and season. Automatically reorder before stockouts happen. Reduce dead inventory by deprioritizing units the model shows declining demand for. This is particularly high-impact for businesses running across multiple warehouses or channels.
Lead Scoring and Conversion
The model predicts which prospects will close in the next 60 days. Your sales team stops touching low-probability accounts and focuses where the probability of close is highest. That's not a process change. It's a revenue multiplier.
Capacity Planning
Forecast headcount and resource needs 2 to 3 quarters ahead based on revenue trajectory, support volume, and engineering complexity. The decision to hire, contract, or hold becomes evidence-based rather than a gut call made too late to act on properly.
Ready to move beyond dashboards? Let's scope your forecast.
Common Traps: Where Predictive Analytics Projects Fail
Most predictive analytics projects don't fail because the technology doesn't work. They fail because of execution and scoping problems that are entirely avoidable.
Garbage-in, garbage-out. Models trained on bad data, inconsistent field definitions, or large gaps in history produce noise. The forecast looks plausible until it isn't, and once leadership loses confidence, it's hard to recover.
No business translation. A 98% accurate model that predicts in feature space your CFO can't read is worthless. Every forecast needs a plain-language explanation attached to it.
Ignoring explainability. "The model says Q3 revenue is 15% lower" without context creates doubt and disengagement. Leadership doesn't act on opaque signals. They ask for more data, run another meeting, and the window closes.
The most dangerous predictive analytics project is one that's technically correct but organizationally ignored. Explainability isn't a feature, it's the product.
Scope creep. Building the perfect 12-metric forecast model before delivering any value is how projects stall at month nine with nothing shipped. Start narrow: one use case, one clear outcome, one team that will act on the forecast. Prove it, then expand.
Separation from action. A weekly forecast email that nobody routes into a workflow stays art, not science. The prediction has to connect to something that changes what someone does on Monday morning.
How GroovyMark WebX Brings Predictive Analytics to Life for Your Enterprise
GroovyMark WebX builds Predictive Analytics & BI that doesn't just surface historical trends. It predicts your next quarter with driver-level explanations your team can act on.
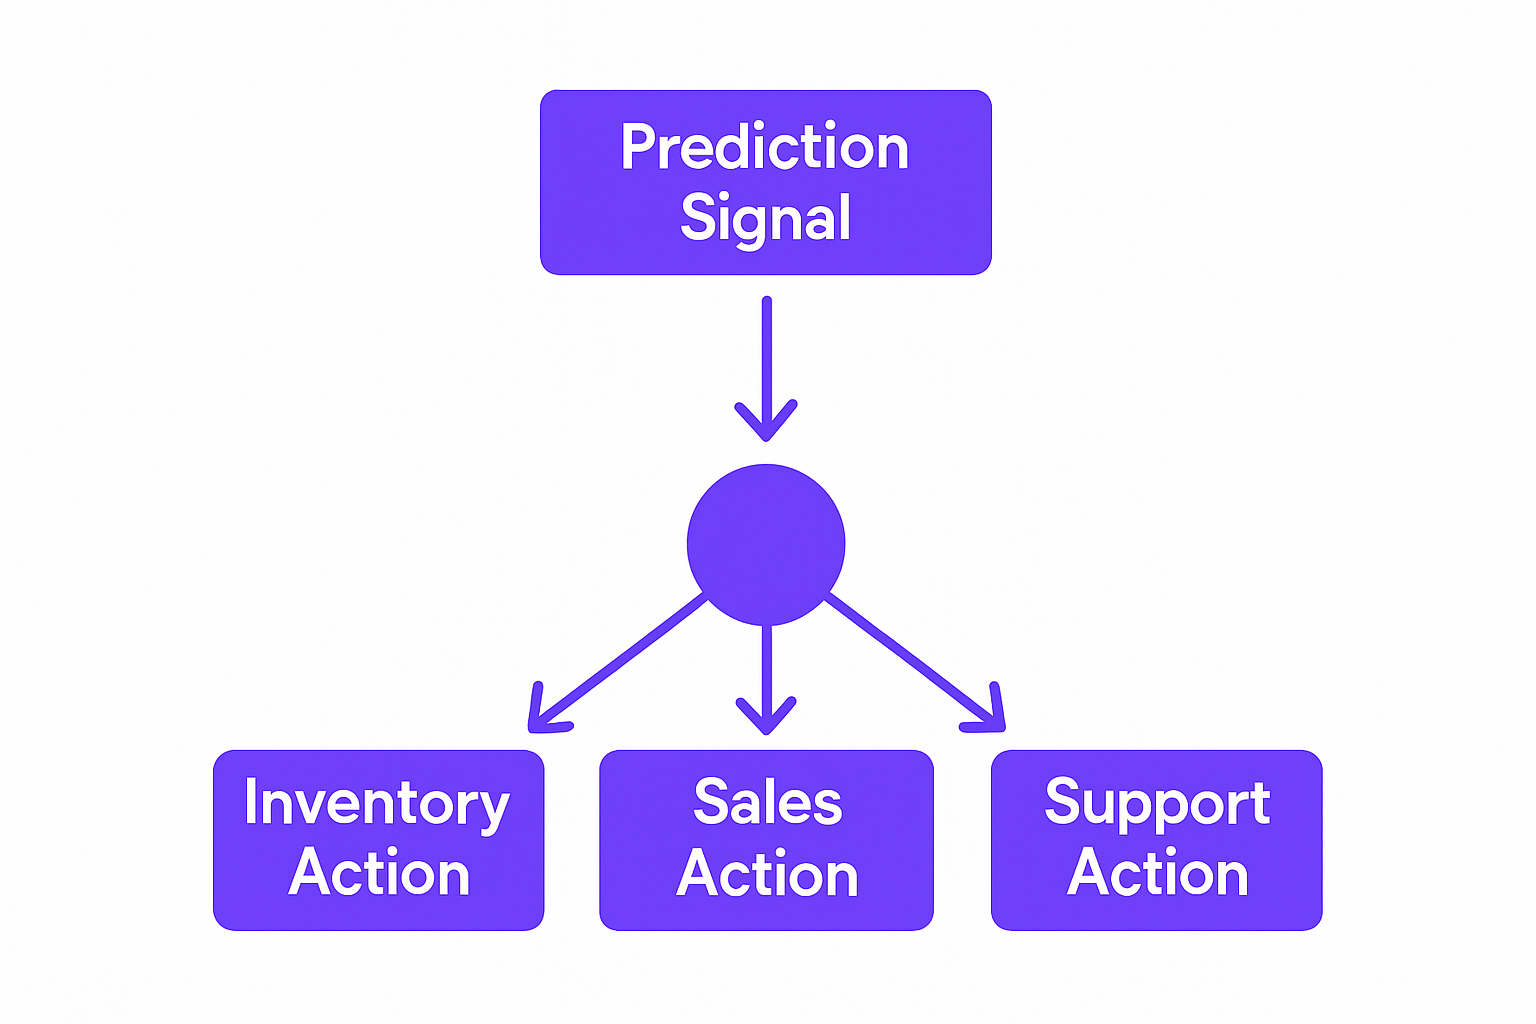
Decision tree showing how predictive signals route to inventory, sales, and support teams
Our approach starts with your actual systems. ERP, CRM, financial data, operational logs. We connect them, audit the quality, engineer the features that matter to your specific business model, and train models on your data. Not a pre-configured SaaS platform that costs $80K a year and locks you into their feature roadmap. Your data, your models, your infrastructure.
Senior engineers handle every layer: ingestion, feature work, model tuning, integration, and automation. No black-box third-party platforms. No vendor lock-in. You own the models, the data, and the predictions. When you need to pivot or extend the system, you don't wait for a sprint cycle from a vendor who doesn't know your business.
The delivery pattern we follow is deliberate. We scope the first use case tightly (typically revenue or churn), deliver a working forecast in 8 to 12 weeks, validate it in production, then layer in additional forecasts once leadership has seen it work. That's how you build organizational trust in a model, not by presenting a proof of concept in a Jupyter notebook.
Most enterprises see ROI within that first engagement: 20 to 30% improvement in forecast accuracy, 40% or more reduction in unplanned stockouts, or 15% or better uplift in sales conversion from lead scoring. Those aren't hypothetical ranges. They're what the McKinsey & Company research tracks across comparable deployments, and they align with what we've seen across the businesses we've worked with.
If you want to talk to us about your data and what a forecast system would actually look like for your business model, the conversation starts there.
The enterprises pulling ahead of their competitors right now aren't doing it with better dashboards. They're doing it with earlier, more accurate signals and the automation to act on them. That's what a properly built predictive analytics system delivers. See how we've done this before across revenue, inventory, and churn use cases for teams like yours.
See how predictive analytics works for your business model.
Frequently asked questions
What's the difference between predictive analytics and a BI dashboard?
BI dashboards show what happened. Predictive analytics show what will happen and why. A dashboard tells you revenue was down 10% last month; predictive analytics tells you revenue will drop 15% next quarter because your SMB churn rate is spiking, and it recommends which accounts to contact immediately. GroovyMark WebX builds both—but the predictive layer is where your team gains real competitive advantage.
How long does it take to build a predictive analytics system?
A focused forecast (e.g., revenue or churn prediction) can deliver value in 8-12 weeks. That includes data connection, feature engineering, model training, and integration into your workflows. Multi-forecast platforms take 3-4 months. GroovyMark WebX delivers on a fixed timeline because we scope carefully and our team owns the end-to-end delivery—no handoffs or delays.
What if our data is messy or incomplete?
That's the norm. Messy data means we start with a data audit and cleaning phase (2-3 weeks) before we engineer features. Missing historical data doesn't stop us—we work with what you have and often uncover data silos you didn't know existed. GroovyMark WebX has fixed data problems across hundreds of enterprise systems; we know where to look and how to reconcile it.
Can predictive analytics be automated into our existing workflows?
Yes. Forecasts can trigger alerts, send notifications to Slack, automatically reorder inventory, flag high-risk customers for sales outreach, or populate dashboards your team already uses. The real value isn't the prediction—it's the action. GroovyMark WebX builds the full chain: prediction, explanation, and automation. Your team gets foresight that actually changes what you do, not just what you know.
How do we know the model is accurate?
Accuracy is measured against holdout test data and validated in production over time. We deliver not just a number (e.g., 87% accurate) but confidence bands and explainability—what's driving the forecast and where it might be wrong. We also retrain quarterly to keep pace with your actual business changes. When you work with GroovyMark WebX, you own the model and the data; transparency and continuous improvement are built in.