Real-Time Data Pipelines: Building Analytics That Actually Keep Up
Real-time data pipelines let you act on what's happening in your business right now, not on a report generated six hours ago. This guide covers the core architecture, seven reliability patterns, five mistakes to avoid, and exactly how to build a pipeline that holds up under real production load.
The Cost of Stale Data: Why Real-Time Pipelines Matter Now
Batch-processed analytics cost you money in ways that are easy to miss until it's too late. Inventory stockouts, undetected fraud, and missed upsells don't announce themselves. They show up in your P&L a week after the window to act has closed.
Most analytics stacks are running 4 to 24 hours behind reality. Your operations team gets a report every morning, opens it, and discovers a problem that started yesterday afternoon. By the time a ticket is raised and someone looks at the raw data, the damage is done.
The numbers aren't abstract. According to IBM's research on data quality and downtime, the cost of acting on delayed information runs into billions annually across industries. That figure isn't the result of catastrophic system failures. It's the slow bleed of incremental decisions made on stale inputs.
Competitors who have built live pipelines are already responding to market signals while your batch job is still running. That's not a hypothetical competitive disadvantage. If you're in eCommerce, SaaS, or financial services, someone in your market already knows which SKUs are selling out in real time, which trial users just hit a usage threshold, and which transactions look anomalous. They're acting. You're reading yesterday's summary.
Real-time visibility doesn't just shorten incident response from hours to seconds. It changes the category of decisions you can make. You move from reactive to operational.
How Real-Time Data Pipelines Work: The Core Architecture
Real-time data pipelines work by continuously capturing data at the source, routing it through a message broker that preserves event order and handles backpressure, applying transformation logic in motion, and writing the processed output to storage that your dashboards can query instantly. The key is that data moves continuously, not in scheduled batches.
Here's how the layers fit together.
Ingestion Layer
Sources emit data continuously. That could be a PostgreSQL database writing change-data-capture (CDC) events, IoT sensors firing every 100 milliseconds, API webhooks from Stripe or Salesforce, or user interaction events from your web application. Each source connects to the ingestion layer, which normalizes the format and hands events off to the broker.
Message Broker and Stream Processor
This is the backbone. Apache Kafka Documentation covers stream processing and event sourcing in depth, and Kafka itself has become the default choice for high-throughput pipelines. Managed alternatives like AWS Kinesis and Google Cloud Pub/Sub remove the operational overhead of running your own cluster. The broker buffers events, maintains ordering within partitions, and ensures that slow downstream consumers don't cause data loss upstream.
Stream processors like Apache Flink or Kafka Streams sit on top of the broker and apply your business logic in motion: filtering, aggregation, joining streams, enriching events with reference data, and computing rolling window statistics.
Storage and Visualization
Hot data lands in fast query stores: in-memory caches like Redis for sub-millisecond lookups, columnar databases like ClickHouse or BigQuery for analytical queries, or time-series databases like InfluxDB for sensor and metrics data. From there, your dashboards query live. Alerts fire the moment a threshold is crossed, not when someone opens a report.
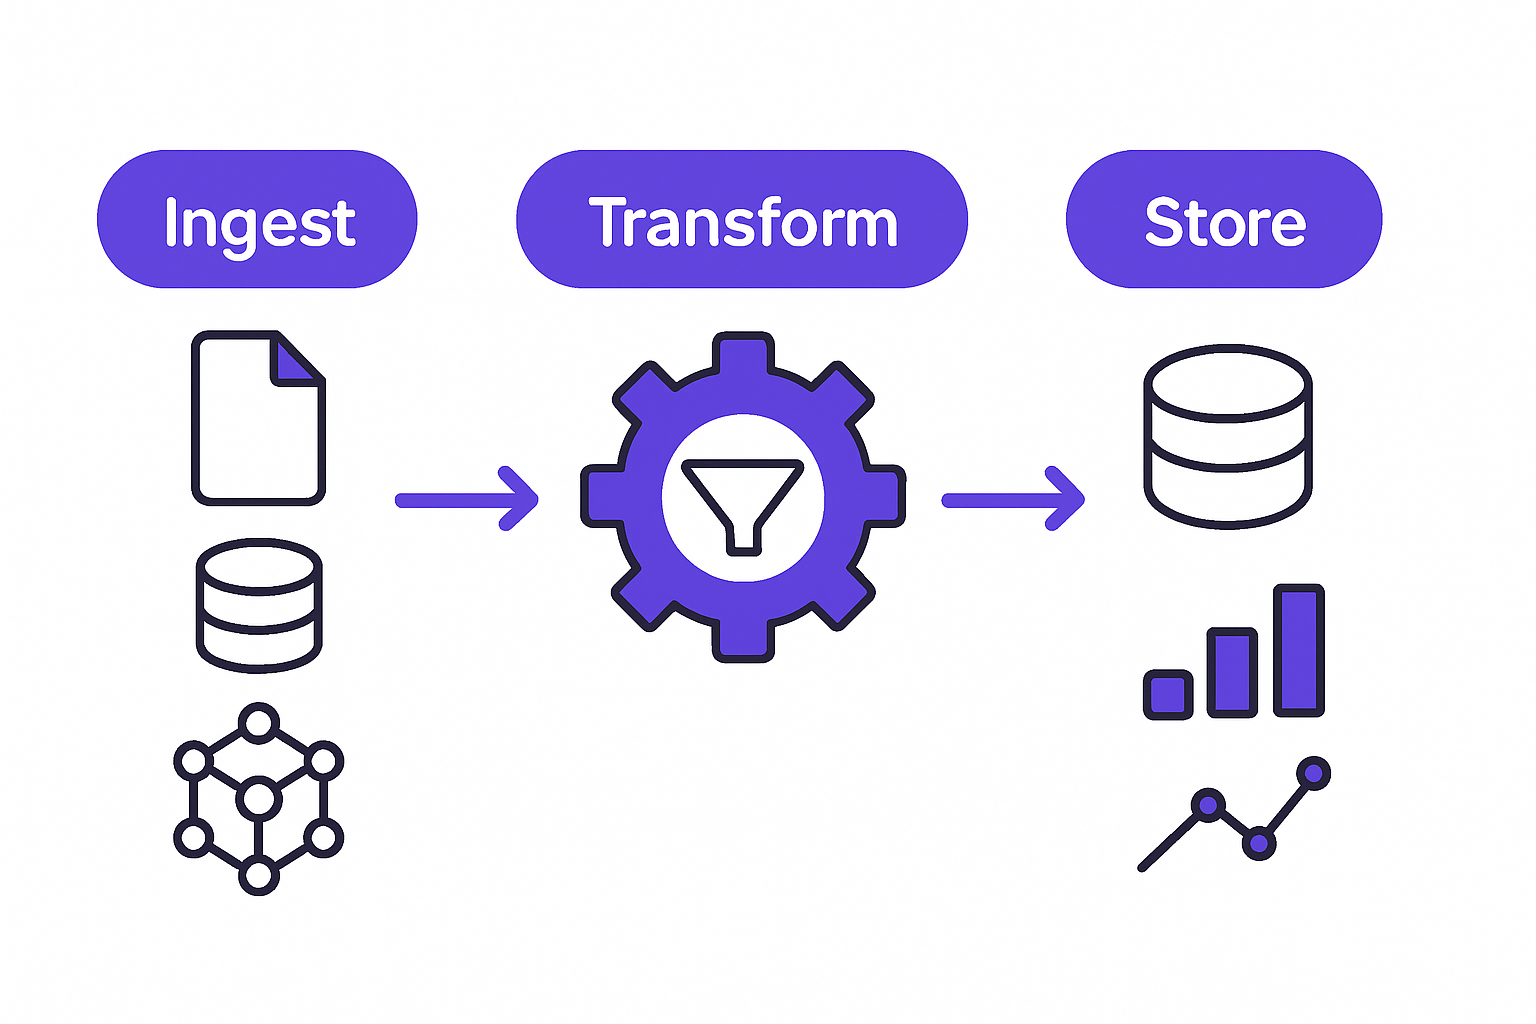
Real-time data pipeline architecture with three layers
Seven Patterns That Make Real-Time Pipelines Reliable
A working real-time pipeline isn't just fast. It's fault-tolerant, predictable, and auditable. These seven patterns are what separate pipelines that hold up in production from ones that need babysitting.
Event Sourcing
Store every state change as an immutable event in an append-only log. Your current state is just the projection of that log. This means you can rebuild any view, fix a bug in your transformation logic, and replay history without touching your live sources. Martin Kleppmann's "Designing Data-Intensive Applications" makes a compelling case for this pattern as the foundation of any serious streaming architecture.
Idempotent Processing
Design every processing step so that running it twice produces exactly the same result as running it once. Networks fail. Messages get redelivered. If your step isn't idempotent, a retry will corrupt your data. Assign a unique event ID at the source and check for duplicates before writing downstream.
Dead-Letter Queues
When a message fails to process, don't drop it and don't block the main flow. Route it to a dead-letter queue where you can inspect it, fix the underlying issue, and replay it when you're ready. Without this, a single malformed event can stall your entire pipeline.
Backpressure Handling
If downstream consumers can't keep up with the ingestion rate, your broker's queue depth will grow until it explodes. Implement backpressure signals so the ingestion layer slows when downstream is struggling. This is especially critical for pipelines that handle traffic spikes.
Windowing and Micro-Batching
Not every metric makes sense as a point-in-time measurement. Aggregations (sum, average, count, rate) need a time window. Tumbling windows give you fixed, non-overlapping periods. Sliding windows give you a rolling view. Micro-batching groups events into small time-bound windows, typically one to five seconds, to keep aggregation efficient without sacrificing meaningful latency.
Schema Evolution
Your data producers will change. Fields get added, renamed, or removed. If your consumers break every time a producer changes, your pipeline is fragile. Version your schemas using a schema registry, make changes backward compatible where possible, and give consumers time to migrate independently.
Observability
The AWS Well-Architected Framework lists observability as a core pillar of operational excellence, and for real-time systems it's non-negotiable. Emit metrics at every stage: consumer lag, throughput events per second, error rate, processing latency, and schema mismatch counts. If you don't know the health of your pipeline before your users notice something is wrong, you've already lost.
Building Pipelines That Scale Without Breaking
Start smaller than you think you need to. Pick one data source and one consumer, validate the pattern end-to-end, measure latency, confirm idempotency, and stress-test failure modes before you expand. Adding complexity before the foundation is proven is how pipelines fail in production six months in.
Use managed services first. AWS Kinesis, Google Cloud Dataflow, and Confluent's managed Kafka all remove significant operational burden. Rolling your own Kafka cluster is an option, but it requires dedicated ops capacity to maintain. Unless you have a specific reason to self-host, the managed path gets you to production faster and with less risk.
Test failure modes deliberately. Kill the message broker mid-run. Pause a database connection. Inject malformed events. Trigger a consumer restart. Your pipeline has to handle every one of these gracefully and recover without data loss or duplication. If you haven't tested it explicitly, you haven't tested it.
Keep ingestion and transformation separate. This architectural boundary lets you replay historical data through a new or updated transformation layer without having to re-ingest from live sources. It also means you can swap your stream processor without touching how data gets into the system.

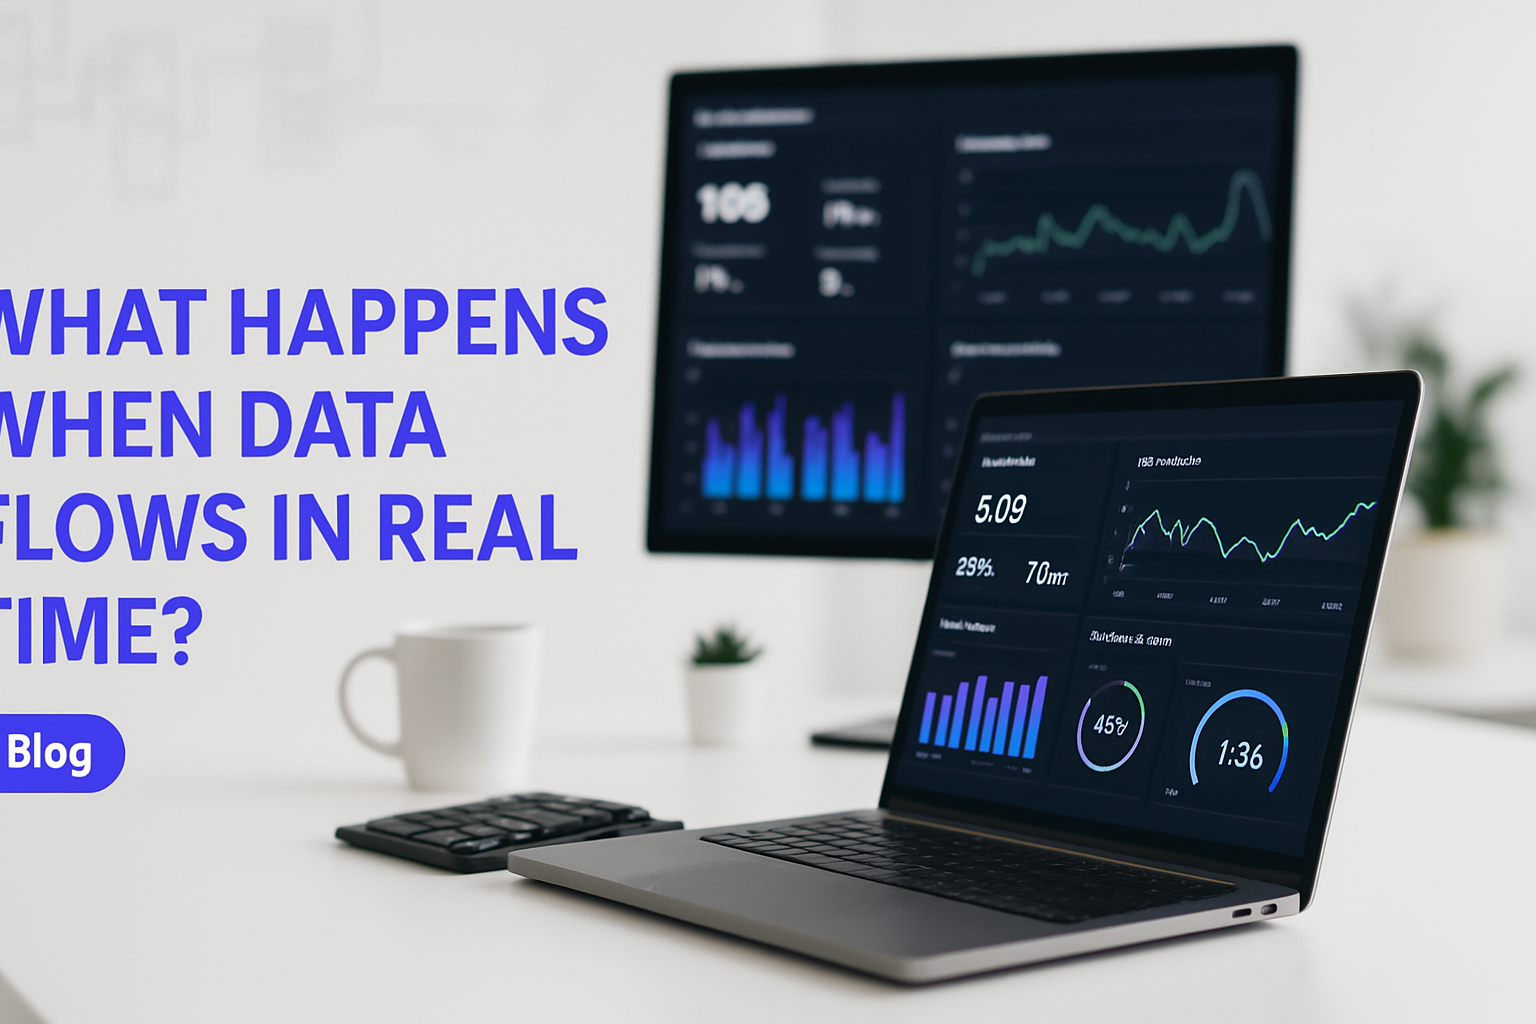
Engineer monitoring real-time pipeline performance and dashboards
Ready to build a real-time pipeline that scales?
Five Mistakes That Derail Real-Time Pipelines
These aren't edge cases. They're the mistakes that show up repeatedly in audits of pipelines that were built quickly and deployed under pressure.
Treating latency as a detail. If you're not measuring end-to-end latency from source event to dashboard render, you don't actually know whether your pipeline is real-time. You know it feels fast. That's not the same thing. Instrument latency percentiles at every stage and set alerts when p95 drifts above your target.
Skipping the message broker. Connecting sources directly to consumers is tempting when you're building quickly. It's also how you guarantee data loss the first time a source or consumer has a hiccup. The broker is what allows sources and consumers to operate at different speeds and recover independently.
Assuming data is clean. It never is. Validate schemas at ingestion, check for duplicate event IDs, handle nulls explicitly, and log every rejection. A rejected event that disappears silently is indistinguishable from an event that never happened, until your metrics are off by 3% and you spend two days figuring out why.
Designing for a single geography. If you plan to serve users in multiple regions, your pipeline design needs to account for time zones, data residency requirements, and the reality that network splits between regions will happen. A naive single-region design breaks or becomes illegal when you expand.
Ignoring storage costs. Real-time systems that retain 90 days of granular events at high volume will generate cloud bills that are genuinely surprising if you haven't modeled them upfront. Plan your retention policy, tiering strategy, and compression approach before you start accumulating data.
From Metrics to Action: How GroovyMark WebX Helps You Ship
Building a real-time pipeline from scratch requires holding a lot of moving parts in your head at once: ingestion, brokering, transformation, storage, monitoring, and the operational scaffolding that keeps all of it running. Most engineering teams have the skill to do parts of it. Few have the bandwidth to do all of it well while shipping product.
At GroovyMark WebX, we build Real-Time Operations & IoT Dashboard solutions that connect directly to your live data pipeline. No manual refreshes, no silent latency surprises, no dashboards that show you yesterday's state dressed up as today's. We design the full stack: from the ingestion layer through the transformation logic to the visualization layer your operations team actually uses.
Our team works with your existing data sources. Databases, third-party APIs, IoT devices, SaaS platforms. We integrate them into a unified real-time view and instrument every stage so you know what's happening at the pipeline level before your users notice anything is wrong.
"The goal isn't a dashboard that looks impressive in a demo. It's a system that tells you something happened before you had to ask."
For teams dealing with fragmented data flows and manual reporting, we also connect real-time analytics work to Business Process & Workflow Automation, so that live data doesn't just inform decisions but triggers the right downstream actions automatically.
Check our case studies to see how founders and operations leaders have gone from batch-processed lag to live operational visibility.
If you want a direct assessment of where your current architecture stands, start a conversation with us. GroovyMark WebX will audit your setup, identify the highest-value gaps, and map a concrete path to real-time operations without over-engineering what you don't need yet.
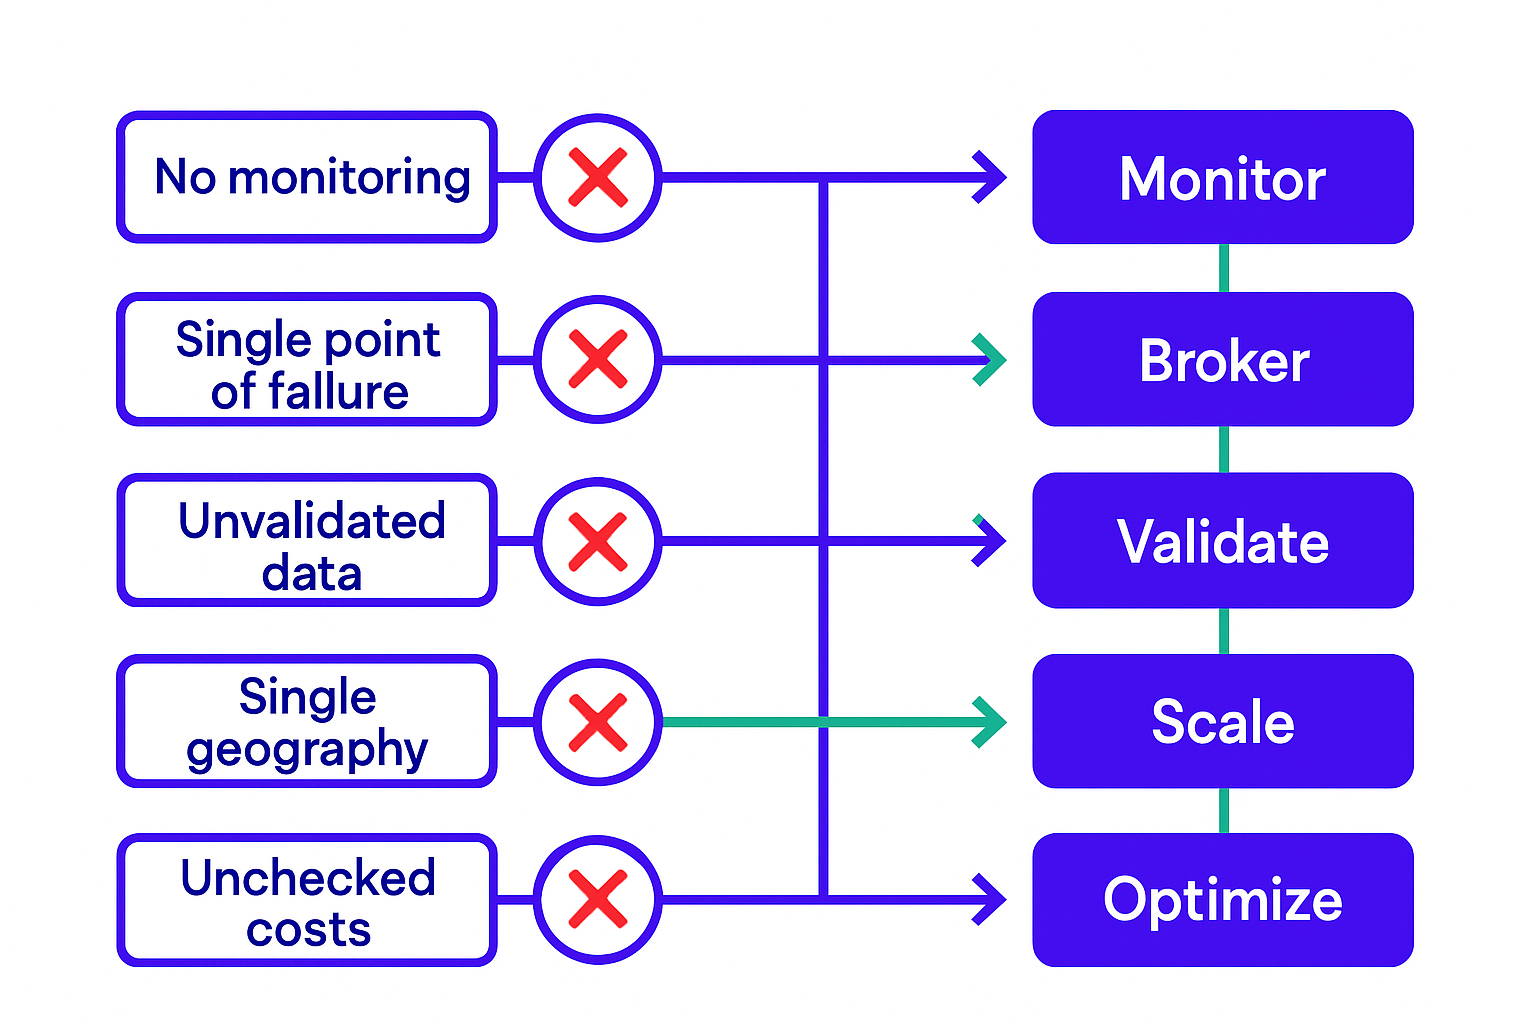
Common real-time pipeline mistakes and how to avoid them
Real-time data pipelines aren't a luxury for companies with large data teams. They're the infrastructure that lets you operate your business instead of just reporting on it. The architecture is proven, the tooling is mature, and the cost of waiting is compounding.
If you're ready to move from yesterday's reports to live operational intelligence, GroovyMark WebX is the team to build it with you.
Let's audit your data architecture.
Frequently asked questions
What's the difference between real-time and near-real-time data pipelines?
Real-time pipelines process and surface data with latency measured in milliseconds to low single-digit seconds. Near-real-time adds minutes of delay. The choice depends on your use case: fraud detection and live operations need true real-time; most business dashboards work fine with near-real-time. GroovyMark WebX builds pipelines that hit your actual latency requirements, not based on buzzwords.
How do I know if my pipeline is actually working in real-time?
Measure end-to-end latency: from the moment data is generated at the source to the moment it appears in your dashboard or triggers an alert. If you can't measure it, you don't know it works. GroovyMark WebX instruments every pipeline we build with latency percentiles (p50, p95, p99) so you always know where you stand.
Can real-time pipelines handle millions of events per second?
Yes, with the right architecture. Message brokers like Kafka and stream processors like Flink are designed for it. The bottleneck is usually not throughput but cost and operational complexity. GroovyMark WebX designs pipelines that scale to your volume while keeping operational overhead minimal.
What happens if my pipeline goes down?
That's why you need a message broker and dead-letter queues. Sources queue events while the pipeline recovers. Once you're back up, you replay the queue without data loss. If you skip the broker and connect sources directly, you lose everything. GroovyMark WebX builds pipelines with built-in resilience and monitoring so outages are rare and recovery is automatic.
How much does a real-time data pipeline cost?
Costs depend on event volume, retention period, and storage type. A startup processing 10K events per second might spend $500–$2K per month on infrastructure; an enterprise with billions of events per day could spend $50K+. GroovyMark WebX helps you model costs upfront and optimize as you scale, so you're never surprised by cloud bills.